The fundamental aim of this project has always been to create an interactive platform where people can access critical information about their buildings in a clear, engaging, and easy-to-use way.
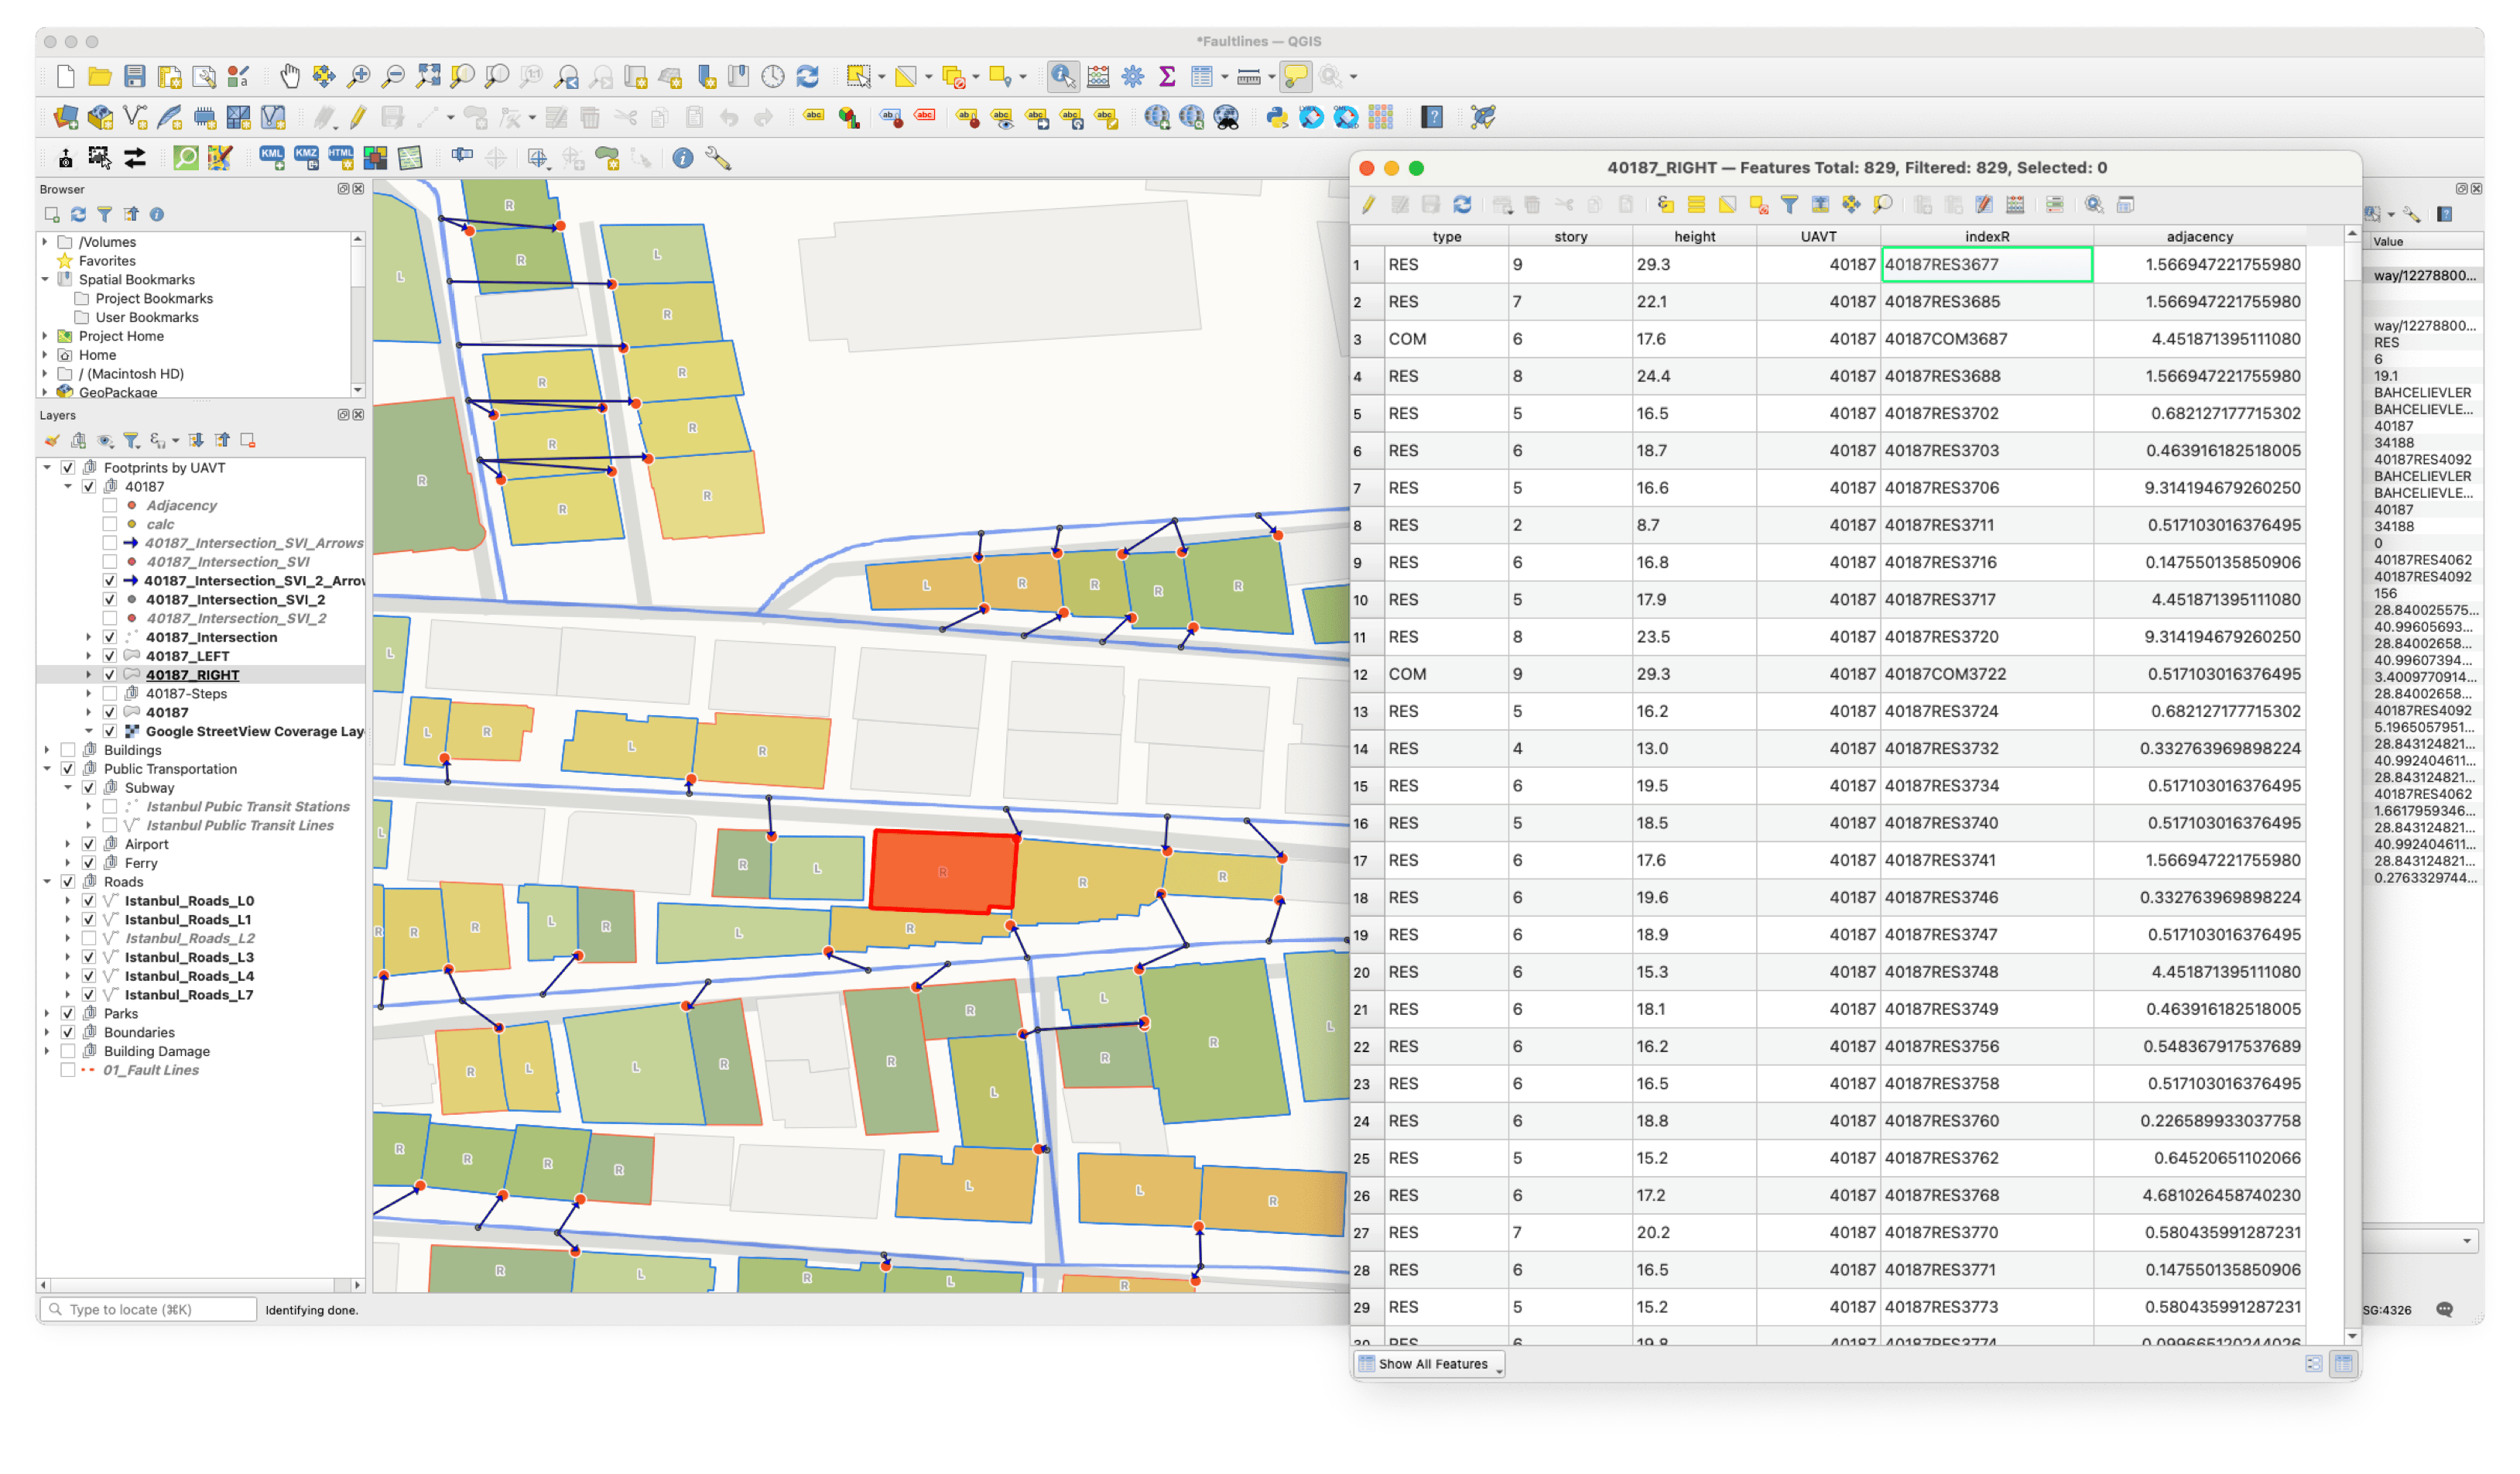
By leveraging recent advancements in computer vision, AI, and computing power, we've trained computers to examine the built environment much like an architect or engineer would, parsing visual information into meaningful insights. The resulting datasets are then funneled into an immersive interactive map where anyone can look up their address and access machine-generated structural insights.
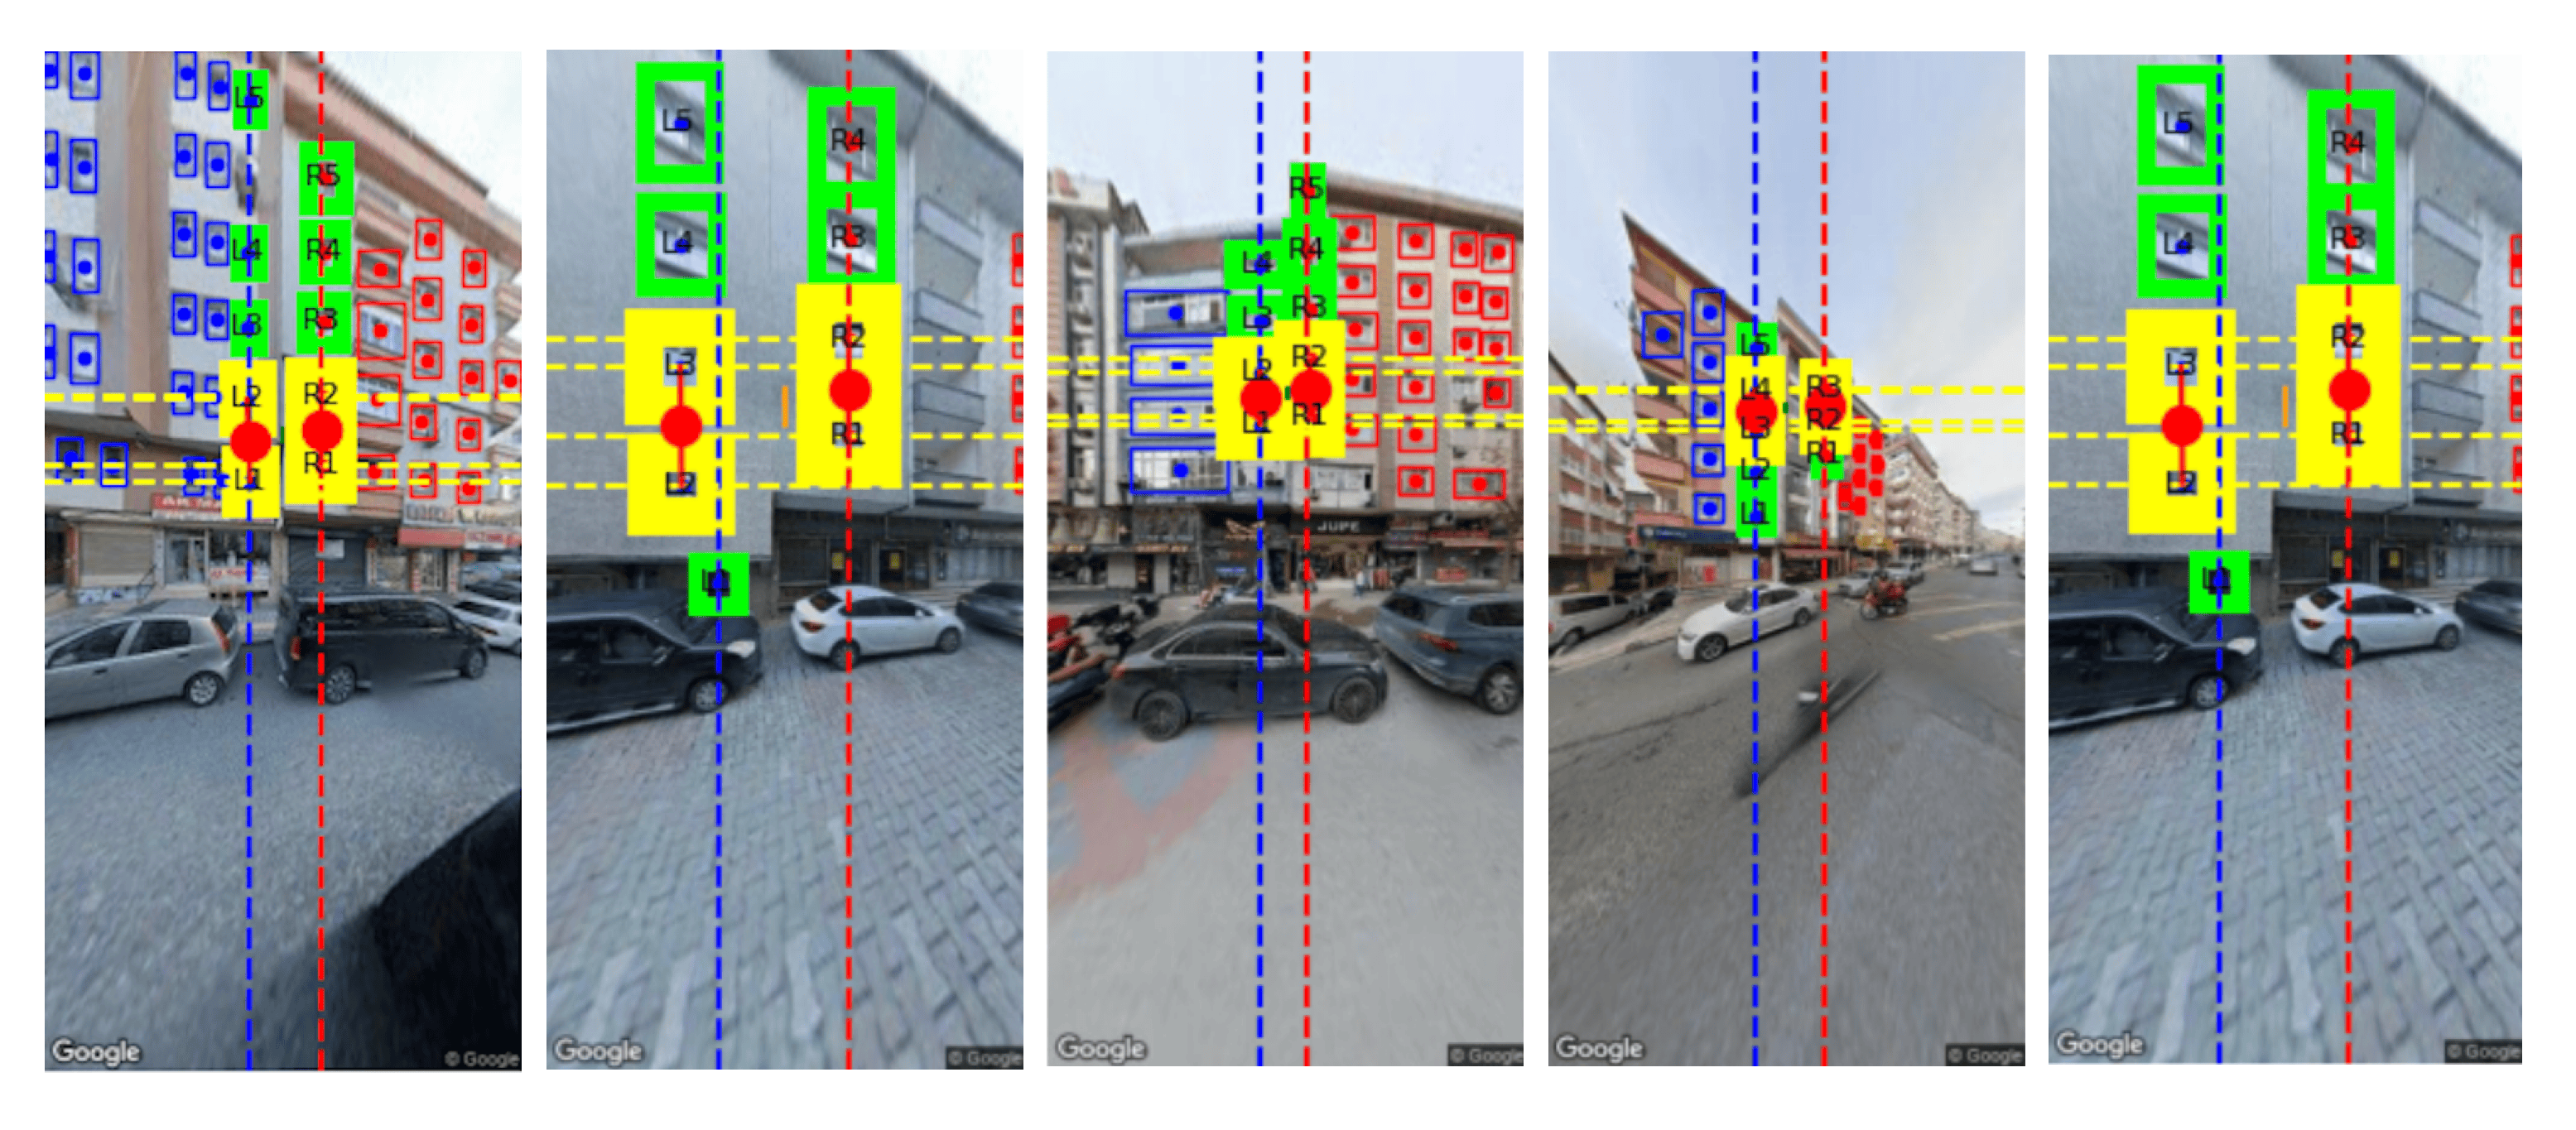
When dealing with AI-generated data, transparency is essential, especially because much of this data comes from "blackbox" processes that aren't always easy to control or interpret. To address this, we made sure that every step of our computations on the initial images was clear, explainable, and easy to share. We were upfront about our objectives with each calculation and used straightforward language to encourage users to critically evaluate the AI-generated results. This approach ensures that these "risk insights" are seen as part of an ongoing process rather than definitive answers, while also equipping people with the knowledge to identify important structural indicators in their surroundings.
Ethical Concerns &
Future Research Discussions
While this study maintains an optimistic perspective on AI-driven initiatives for the public good, there remains numerous complex challenges to be addressed moving forward. Below are some highlights from this year-long discussion:
1. How can we develop better validation methods for AI assessments beyond current practices? What testing procedures ensure AI models are validated against benchmarks or ground truth data? How will structural engineers review AI-generated assessments, and how will their expertise refine the models?
2. Structural issues often stem from internal defects not visible externally. How does the project address undetectable flaws? How can we combine AI-generated surface-level data with existing datasets like municipal inventories, geological surveys, and seismic history to gain deeper insights into the built environment?
3. How can we clearly differentiate AI-generated assessments as insights rather than factual data? Could this distinction help develop solutions that protect the most vulnerable, instead of being used as grounds for forced evacuations or other punitive measures?
4. How can we communicate the limitations of AI assessments to build trust in the data without causing undue fear or stress? How can the project share information that encourages proactive safety measures?
5. Obligation to inform vs. risk of harm: Is there a moral imperative to inform residents about the structural safety of their buildings, even if the information may cause panic or distress among those unable to relocate or retrofit?
6. How should access to this data be managed to balance open availability with privacy concerns? How can the project ensure that any citizen who wishes to access the information can do so, while respecting the privacy and rights of those who choose not to participate?
7. To what extent are the AI algorithms and decision-making processes transparent to stakeholders? How does this transparency build trust in the assessments?
8. How can educational resources alongside risk assessments help residents make informed decisions? How can the project involve community members to ensure actions align with their needs and capabilities?
9. Who is responsible if an inaccurate AI assessment leads to harm or consequences for property owners?
10. What protocols should be established to prevent the misuse of AI-generated data by public or private organizations, such as governments or insurance companies, ensuring that vulnerable populations are not disproportionately targeted or disadvantaged?
Using the Map
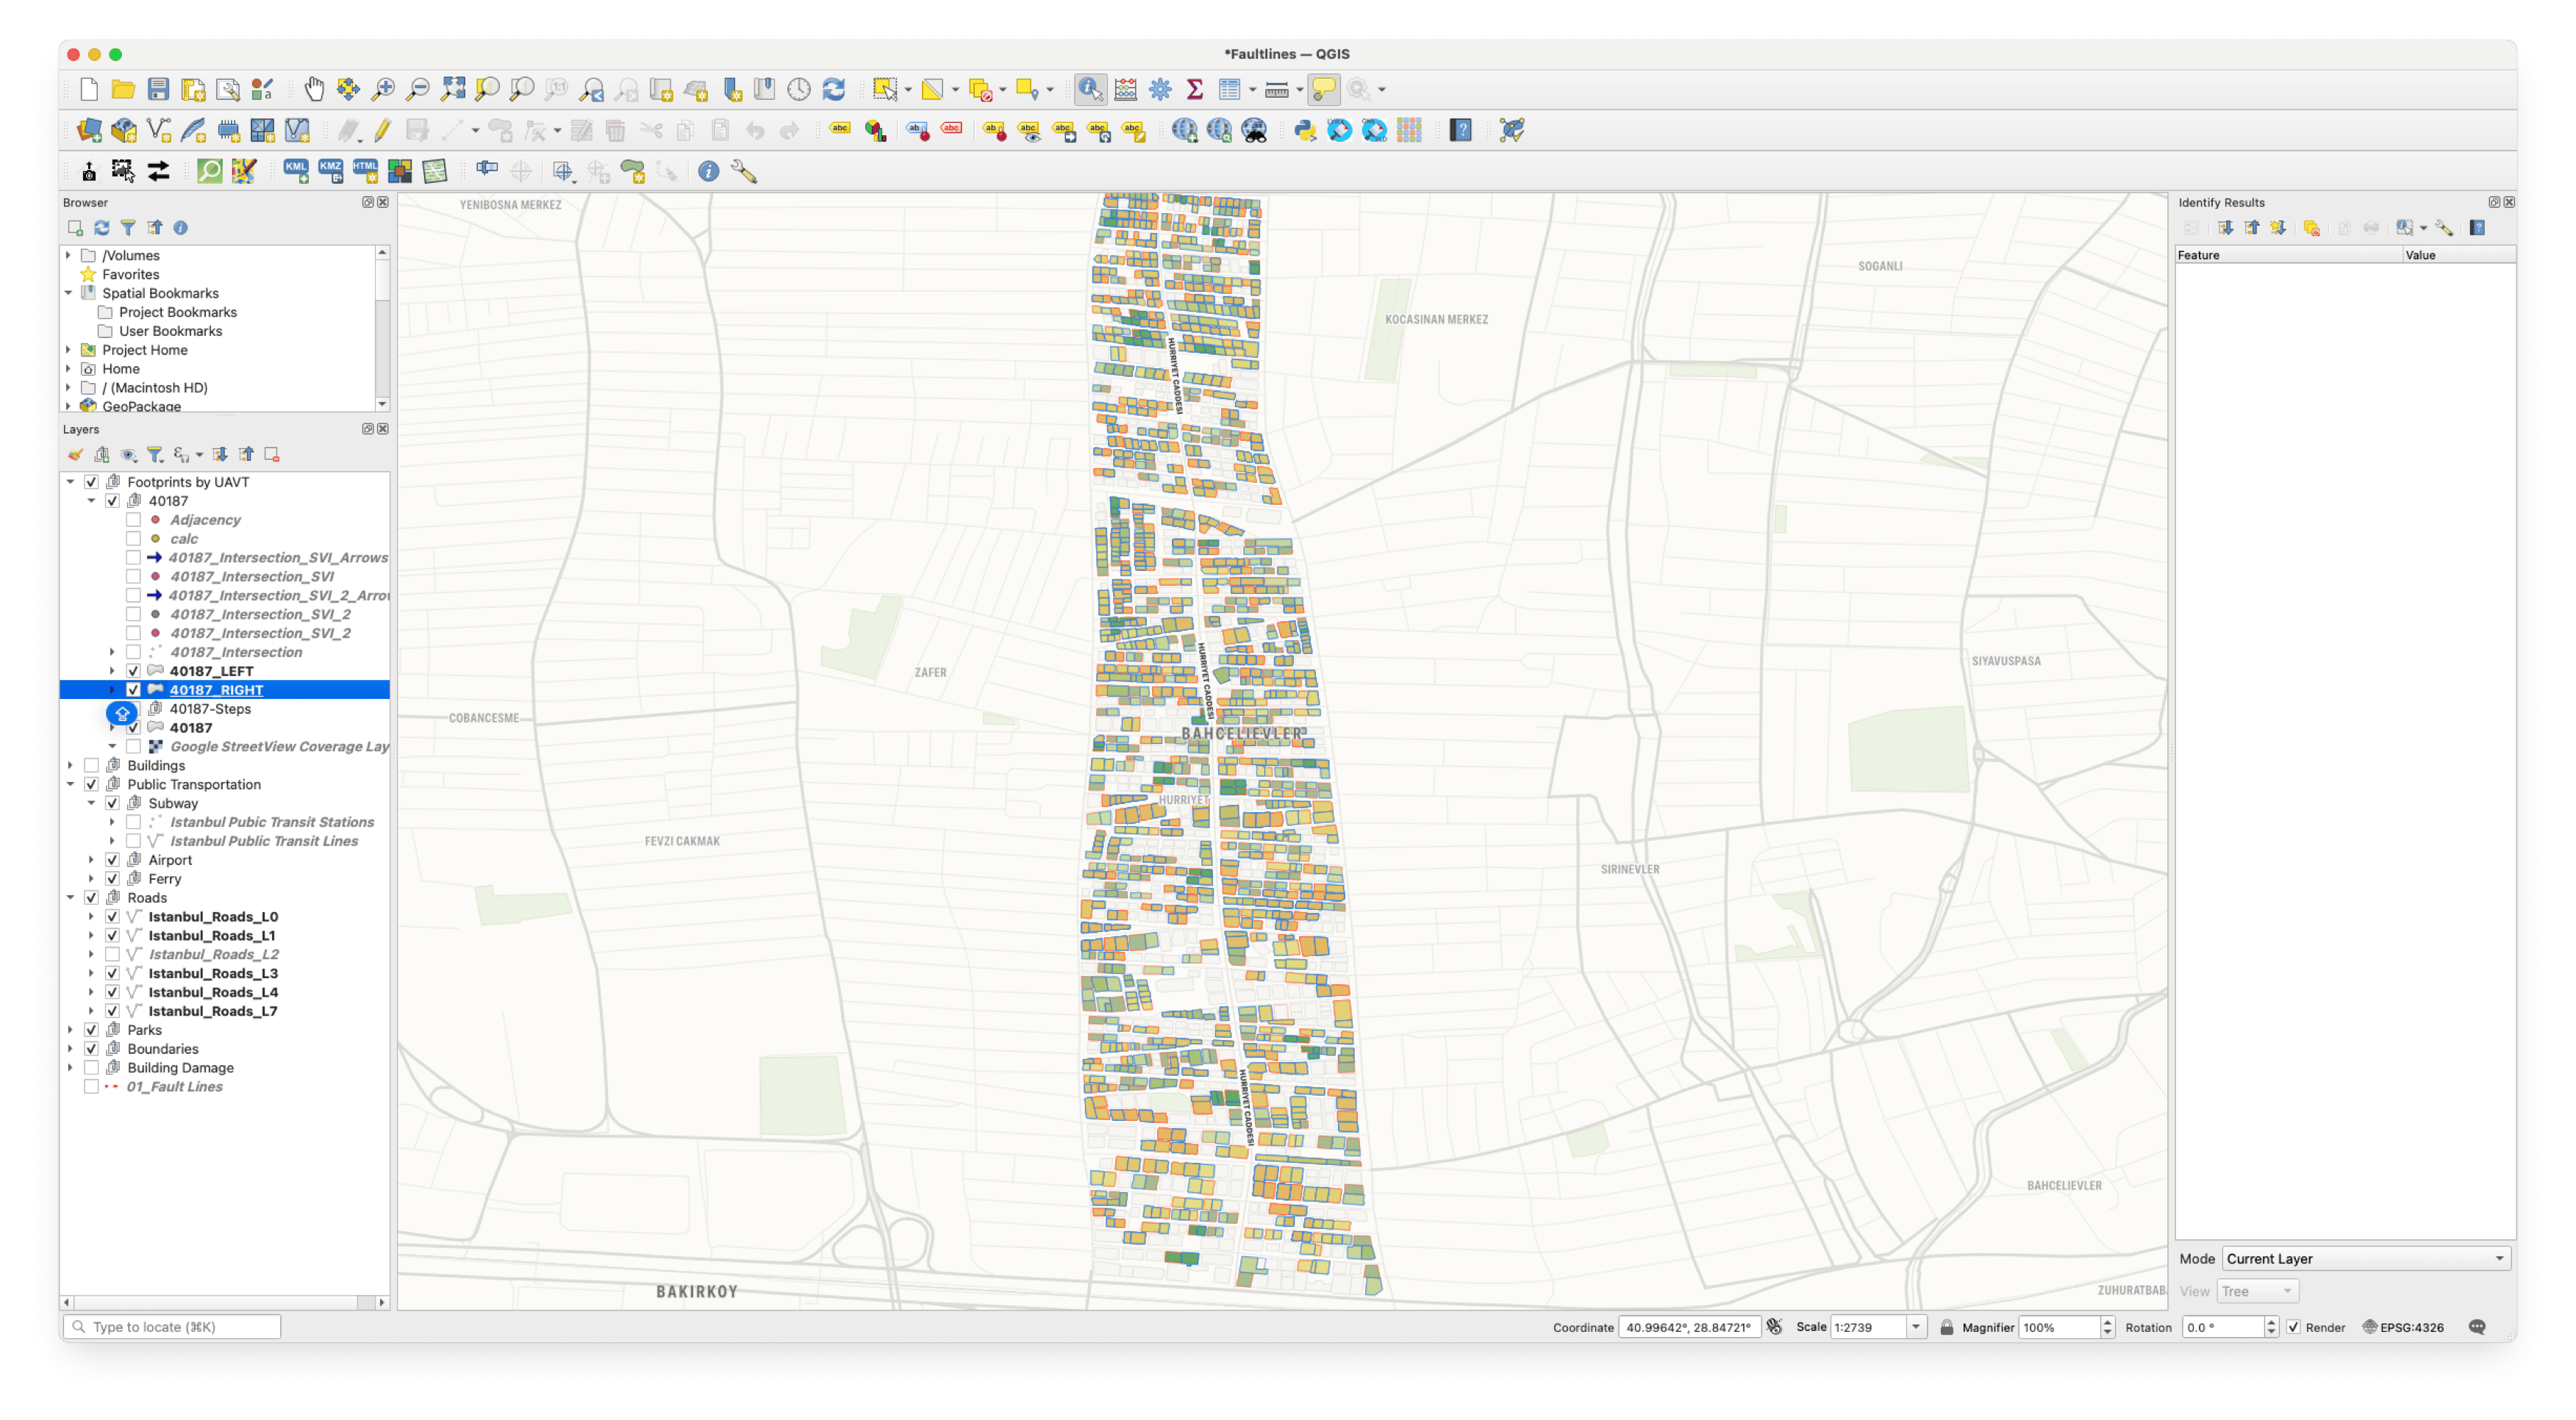
Below is the first publicly accessible interactive map, the culmination of a year-long research effort at the Center for Spatial Research. As of now, you can explore risk insights related to "misaligned floor calculations" in Hürriyet Mahallesi, a pilot neighborhood densely populated with buildings constructed before the 1999 Earthquake, where open spaces and greenery are scarce. This area is particularly noteworthy in the IMM Earthquake Risk Simulation dataset due to its high projected levels of damage and casualty rates.
Use the search bar to find building names, door numbers, addresses, and more (currently limited to available ZIP codes), or simply hover over a building to view a detailed risk report and a visual summary of the tests conducted. The interactive map will gradually expand to cover all boroughs and ZIP codes across Istanbul, with more tests and data contributing to the overall risk score for each building.